Getting started with custom styles and CFCHART
While working with some basic cfcharts, I came across an entry on Ray Camden's site that made me realize I had overlooked a powerful tool for manipulating chart styles.
Now if you have heavy duty charting needs, you are probably using something other than cfchart already. So this entry may be "one big yawn" for you. But if you are doing basic to moderate charting and would like a little more control over the chart styles, and are not familiar with WebCharts3D, read on.
Enter WebCharts3D
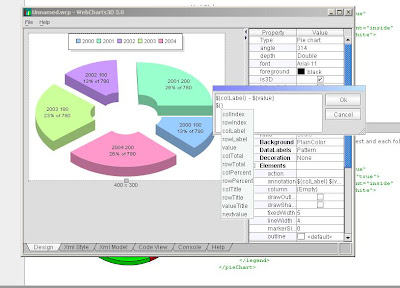
The real jewel in Camden's entry was the mention of the WebCharts3D utility. It turns out the ColdFusion documentation, of all places, contains instructions on how to use this fantastic utility to create chart styles.
Now there are some limitations. Cfchart does not support all of the different styles WebCharts3D is capable of producing. Though from what I have heard there are other ways to produce these charts in ColdFusion besides using cfchart. Barney Boisvert's site has what appears to be an interesting entry about charting with svg and batik. I came across it while searching for information about svg, but confess I have yet to finish it. Same old story, too many interesting topics to research, not enough time.
Anyway, the Webcharts3D utility is quite flexible allows you to modify many of the default styles like data series labels, tool tips, color palettes, etcetera. You can find a complete description of the various properties on the WebCharts site. Again, not all of the properties will be supported by cfchart. But within the the basic chart styles there is a surprising amount of flexibility. Open up the WebCharts3D utility and take it for spin.

And now a few rudimentary style examples from Charts 101 ...
Doughnut Chart 1
<!--- basic doughnut chart with: custom paint palette (DawnTransluent)  --->
<cfchart format="png" style="doughnutChart1.xml">
    <cfchartseries type="pie">
        <cfchartdata item="2000" value="100.0">
        <cfchartdata item="2001" value="200.0">
        <cfchartdata item="2002" value="100.0">
        <cfchartdata item="2003" value="180.0">
        <cfchartdata item="2004" value="200.0">
    </cfchartseries>
</cfchart>

<!--- doughnutChart1.xml --->
<?xml version="1.0" encoding="UTF-8"?>
<pieChart depth="Double" style="sliced" type="SmallNut" angle="314">
        <dataLabels style="Value" placement="Outside"/>
        <legend>
            <decoration style="None"/>
        </legend>
        <popup background="#C8FFFFFF" foreground="#333333"/>
        <paint palette="DawnTransluent" paint="Plain"/>
        <insets left="5" top="5" right="5" bottom="5"/>
</pieChart>
Doughnut Chart 2
<!--- basic doughnut chart with: custom data labels, tooltips (RoundShadow), paint palette (Dawn) --->
<cfchart format="flash" style="doughnutChart2.xml" chartwidth="500" chartheight="300">
    <cfchartseries type="pie">
        <cfchartdata item="2000" value="100.0">
        <cfchartdata item="2001" value="200.0">
        <cfchartdata item="2002" value="100.0">
        <cfchartdata item="2003" value="180.0">
        <cfchartdata item="2004" value="200.0">
    </cfchartseries>
</cfchart>

<!--- doughnutChart2.xml --->
<?xml version="1.0" encoding="UTF-8"?>
<pieChart depth="Double" style="Sliced" type="SmallNut" angle="314">
        <dataLabels style="Pattern" placement="Inside" font="Verdana-10">
        <![CDATA[
$(colLabel) - ${colPercent}
        ]]>
        </dataLabels>
        <elements place="Default" drawOutline="false">
            <morph morph="Grow" stage="None"/>
        <![CDATA[
Year (Amount): ${colLabel}  (${value})\n  Overall: ${colPercent} of ${colTotal}
        ]]>
        </elements>
        <legend placement="Left" />
        <popup decoration="RoundShadow" background="#C8FFFFCC" isAntialiased="true"
            foreground="black"
            isMultiline="true"/>
        <paint paint="Dawn"/>
        <insets left="5" top="5" right="5" bottom="5"/>
</pieChart>
Combination Chart
<!--- basic combination chart with: custom line, bar and toolips --->
<cfchart format="flash" style="comboChart.xml">
    <cfchartseries type="line" serieslabel="Sample 0">
        <cfchartdata item="2000" value="100.0" >
        <cfchartdata item="2001" value="700.0">
        <cfchartdata item="2002" value="100.0">
        <cfchartdata item="2003" value="180.0">
        <cfchartdata item="2004" value="200.0">
        <cfchartdata item="2005" value="400.0">
    </cfchartseries>
    <cfchartseries type="line" serieslabel="Sample 1">
        <cfchartdata item="2000" value="150.0">
        <cfchartdata item="2001" value="300.0">
        <cfchartdata item="2002" value="250.0">
        <cfchartdata item="2003" value="230.0">
        <cfchartdata item="2004" value="250.0">
        <cfchartdata item="2005" value="450.0">
    </cfchartseries>
    <cfchartseries type="bar" serieslabel="Sample 2">
        <cfchartdata item="2000" value="200.0">
        <cfchartdata item="2001" value="200.0">
        <cfchartdata item="2002" value="250.0">
        <cfchartdata item="2003" value="130.0">
        <cfchartdata item="2004" value="450.0">
        <cfchartdata item="2005" value="250.0">
    </cfchartseries>
</cfchart>

<!--- comboChart.xml --->
<?xml version="1.0" encoding="UTF-8"?>
<frameChart is3D="false">
        <frame xDepth="6" yDepth="6" outline="black" leftAxisPlacement="Front"/>
        <xAxis>
            <labelStyle isMultilevel="true"/>
        </xAxis>
        <dataLabels foreground="black"/>
        <elements place="Default" shape="Curve" outline="black" lineWidth="6"
            drawShadow="true" showMarkers="false">
            <morph morph="Grow"/>
            <series index="0" shape="Line"/>
            <series index="2" shape="Bar">
                <paint color="#CC99FF"/>
            </series>
        </elements>
        <popup decoration="Shadow" background="#C8FFFFCC" isAntialiased="true"
            foreground="black"
            isMultiline="true"/>
        <paint palette="Pastel" isVertical="true" max="100"/>
        <insets left="5" top="5" right="5" bottom="5"/>
</frameChart>


4 comments:
What can you do to make the decimal point show up? In other words, instead of displaying 250 for example when you rollover an item, make it display 250.0
@Anonymous,
Try using a "pattern" for the yAxis label, and tweak the zeroes in the mask.
<yAxis ...>
<labelFormat style="Pattern" pattern="#,##0.0#"/>
...
</yAxis>
i tried to create a Doughnut Chart 1,
but my pie is somehow "vertically stretched" - how can i change this behaviour?
@kilian,
Are you setting a different height/width for the chart? If so, adjust the values proportionally. Otherwise, the chart will appear skewed.
By default the width is 1.33% of the height (ie width = 400, height = 300).
-Leigh
Post a Comment